| |
|
|

from the issue of April 12, 2007
|

| |
|
|
| |
Study traces effects of drug testing, larger strike zone on Major League Baseball

Diamond Research

BY TOM SIMONS, UNIVERSITY COMMUNICATIONS
Baseball is all about the numbers.

| | 
 
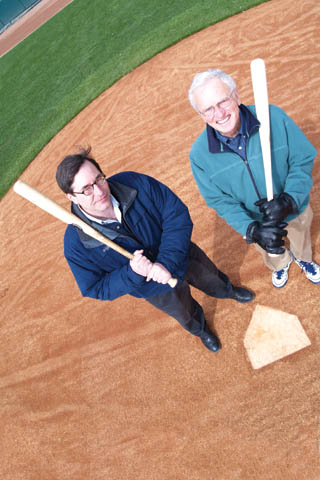
| | | HISTORIANS - A new report by (left) Kenneth Winkle and Ben Rader explores the possible reasons behind a recent dip in Major League Baseball offense.

|
Following the offensive explosion of the late 1990s, Major League Baseball batters cooled at the start of the 2001 season. And, a statistical analysis by two UNL historians offers data to back up two theories for the cause - a larger de facto strike zone beginning in 2001 and the 2003 implementation of a drug-testing program in the major leagues.

In a follow up to a 2002 study, "Baseball's Great Hitting Barrage of the 1990s," Ben Rader and Kenneth Winkle returned to the subject with the benefit of a longer historical perspective and the opportunity to extend their statistical analysis through the 2006 season.

Their research showed three distinct eras of offense in recent baseball history - an era of low productivity (1969-93), the great offensive barrage (1994-2000) and what they termed the "new equilibrium" (2000-06). In comparing the latter two eras, they found a direct correlation between the larger de facto strike zone and lower offensive production, plus a circumstantial, but strong, correlation between testing for performance-enhancing drugs and lower offensive numbers.

In their 2002 study, Rader and Winkle speculated that a new style of hitting may have been the most important factor in the offensive outburst of the late 1990s. Hitters were aided by the umpire's smaller de facto strike zone that in essence took the chest-high inside fastball away from pitchers. Not having to worry about bailing out, sluggers could crowd the plate and swing away. That Major League Baseball recognized this as a problem was demonstrated in 2001 when Sandy Alderson, MLB vice president of baseball operations, tried to retrain umpires before the start of spring training by having them call pitches with minor league batters standing at the plate with white strips taped across their chests, approximately nine inches above the waist (where the rule book said the top of the strike zone should be). A second measure instituted by Alderson in 2001 was the use of the controversial QuesTec pitch-tracking technology in selected parks during regular-season games.

As Rader and Winkle relate in their new study, "Baseball's Great Hitting Barrage of the 1990s (and Beyond) Reexamined," umpires and players (including some pitchers) greeted QuesTec and the new strike zone with howls of protest. But the data compiled by the UNL historians show a dramatic shift in the number of bases on balls allowed per game, indicating the measures had some degree of success.

From 1990 to 1993, the major leagues averaged no more than 6.66 bases on balls per game in a season. Each year from 1994 through 2000 recorded more walks than that, with a high of 7.51 in 2000. From 2001 to 2006, the major leagues had fewer walks per game in each season than in any season from 1994 to 2000, and there were only 6.26 walks per game in 2005, the fewest in at least the last 17 years.

The late 1990s also saw an increase in the average size of hitters. Rader and Winkle report that in 1990, major league batters averaged 2.66 pounds per inch of height. That averaged increased steadily until it reached a peak of 2.73 pounds per inch of height in 1997, 1998 and 1999. The average began to drop after that, and after MLB began drug testing in 2003, it fell to 2.65 pounds per inch in 2006. The average 2006 major-league player weighed nearly six pounds less than a 1998 counterpart.

The changes in height-weight ratios closely track the rise and fall of aggregate major-league output in key offensive categories since 1990 (the numbers in each category are for 1990-93, 1994-2000 and 2001-06):

• Batting average - .259, .269, .265.

• Runs per game - 8.64, 9.92, 9.46 (three seasons from 1994-2000 averaged more than 10 runs per game, with a high of 10.58 in 2000).

• Home runs per game - 1.60, 2.15, 2.17.

• On-base percentage plus slugging percentage - .711, .764, .756.

"Initially, we really thought we were onto something with this weight-height ratio related to offensive productivity, but then it turned out the strike zone is an even stronger correlation," Rader said. "I think the problem with the steroids is you don't know when they're using steroids or the amount.

"Some people claim that the increased weight results from use of steroids, and, boy, it peaks right in the middle of the hitting revolution, then it begins to fall off once they begin to test. They begin effective tests in 2003, and since then, it's down, and in fact it's down below what it was in 1990."

Rader and Winkle said one reason players are stronger than they were 15 years ago is increased emphasis in baseball on strength and conditioning.

But they also reported the worries of baseball executives that use of performance-enhancing drugs can cause players to add more muscle mass than their frames can support, leading to more injuries and more difficulty in recovery.

Rader and Winkle plan to publish the study in NINE: A Journal of Baseball History and Culture. They presented the findings at the journal's 14th annual Spring Training Conference on the Historical and Sociological Impact of Baseball March 15-18 in Tucson, Ariz.
GO TO: ISSUE OF APRIL 12
NEWS HEADLINES FOR APRIL 12
Diamond Research
AgLEC lands Honor
Dunn draws fulldome technology to Astronomy Day
UNL opinions aid downtown Lincoln survey
Annual CASNR Week events begin April 15
Johnsgard
Journalism grad featured in NET special
732778S36937X
|
|
|
|
|
|
|
|